As a Customer Experience (CX) agency, we’re big proponents of keeping your technology stack streamlined for peak efficiency and ease of use. This philosophy extends throughout our internal processes, including our development practice. The better our setups, the more time we can spend helping our clients solve their unique challenges and launch products that delight their users. So, when I noticed an increasing lag time for one of my most commonly used platforms, I decided to investigate. What I discovered just may be a gamechanger for our development team and yours.
Recently, I’ve been struggling with Sitecore’s start up time. That is, the time between when I, as a developer, have completed some change to code, and when I can actually see that change on a web page. In between there is usually some sort of compilation/deployment that takes place. And while that’s happening I have to wait. The longer that time is, the more frustrating. In some cases it’s long enough that I go and work on something else while I wait and then we get into all sorts of context switching problems. So, this past weekend I did a little experiment to see what exactly was going on.
First, a couple of declarations: I did this test using Sitecore 8.2 Update 6, with Visual Studio 2017 on a Lenovo laptop with an Intel Core i7 with 32 GB of RAM running Windows 10. I was running SQL 2014 locally for these tests.
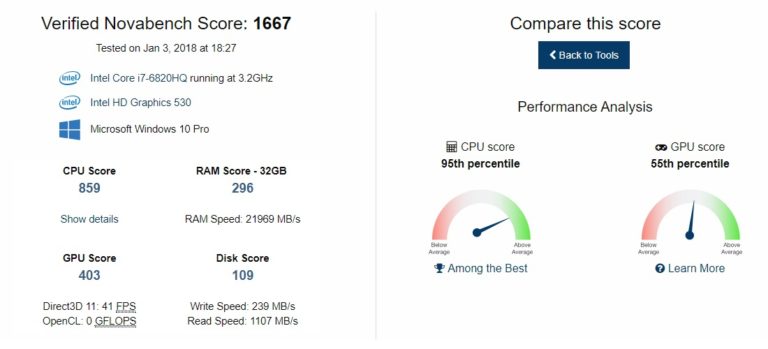
For some reference, I ran a Novabench test of my machine and it scored a 1667.
Vanilla Sitecore
I started by simply installing a vanilla instance of Sitecore. Obviously, no code to compile, so I was just measuring the time between an app pool reset and the page coming up.
Avg Time: 12 Seconds
Add Visual Studio Project
I created a Visual Studio Web Application. The application sits outside the Sitecore web root. At this point the application didn’t really do anything except deploy some connection strings and a data folder config. I used the built in Visual Studio WebDeploy/Publish functionality to deploy to the web root. So I was measuring the time from clicking OnClick Deploy in Visual Studio until the page came up.
Avg Time: 15 Seconds
Add Sitecore.Kernel and Glass Mapper
I added Sitecore.Kernel and Glass Mapper to the Visual Studio solution. Glass Mapper is a tool we often use, and you need Sitecore.Kernel to use it. I added Sitecore.Kernel using Sitecore’s NuGet feed. This is where things started to slow down.
Avg Time: 45 Seconds
Adding Some Patch Files
I added some patch files just patching some of the more normal things that we patch. Enabling media request protection, setting default Rich Text Editor profile, etc. I added 21 patch files.
Avg Time: 47 Seconds
Adding MVC
I added the Microsoft MVC NuGet packages to the solution.
Avg Time: 47 Seconds
Convert To Single Patch File
I wondered if Sitecore’s compilation of configuration was slowing me down, so I converted these 21 patch files into a single patch file. I updated the exact same settings, but using a single patch file.
Avg Time: 47 Seconds
Obviously this had no effect. Compilation time was just as slow as 21 individual patch files.
Add Sitecore’s New Configuration Management
Sitecore 9 comes with a whole new way to manage configuration. Basically, in a patch file, you state what environment the patch file is needed for:
<sitecore role:require="Standalone OR ContentDelivery OR ContentManagement OR Processing OR Reporting">
Then in the web.config you declare when the current environment is. You can use this method in Sitecore 8 as well with a NuGet package: https://github.com/Sitecore/Sitecore-Configuration-Roles
At this point I’m still using a single giant patch file.
Avg Time: 50 Seconds
So, a little slower.
Back to Multiple Patch Files
Converted back to my 21 patch files, still using Sitecore Configuration Roles.
Avg Time: 50 Seconds
Again, no difference.
Adding Dependency Injection
Adding base Glass Mapper classes to the Microsoft Dependency Injection Container used by Sitecore. Also adding my MVC controllers (5 of them). I added them manually, one at a time.
Avg Time: 53 Seconds
This does add some build time.
Changed Dependency Injection To Use Assembly Scanning To Find Controllers
Added assembly scanning to add all of my MVC controllers to the Dependency Injection container, as per this blog post.
Avg Time: 53 Seconds
This made no difference and is less error prone. You don’t need to remember to add each controller to the DI container.
Move The Solution Inside The Web Root
I moved the solution inside the web root.
Avg Time: 44 Seconds
At first, this seems like a significant improvement. But then I realized that it’s not actually a direct comparison with previous tests. Previously, I was deploying with OnClick Publish, which builds and deploys. Inside the web root, I have to manually build, then reload the page. 44 seconds is just reloading the page. I still have to build. So, I will say that this is only slightly better.
Adding Optimize Compilations = true
This setting is suggested by this post.
Basically, it takes a less strict approach to compilation, and doesn’t necessarily compile every little item when you compile.
“When this optimization is turned on (via ), the hash no longer takes into account bin, App_Code and global.asax. As a result, if those change we don’t wipe out the codegen folder.”
Add this switch to the compilation section of the web.config.
Avg Time: 16 Seconds
Whoa! That’s a massive improvement. I recommend a deeper dive into the article to see exactly what’s going on, but, in short, I will always use this from now on. My next step is to see how adding this to a real application helps speed up development. Based on this test, I’m feeling hopeful.
Interested in determining how your Sitecore instance checks out? Use the above steps to run your own test and share your results and discoveries with us on Twitter.


